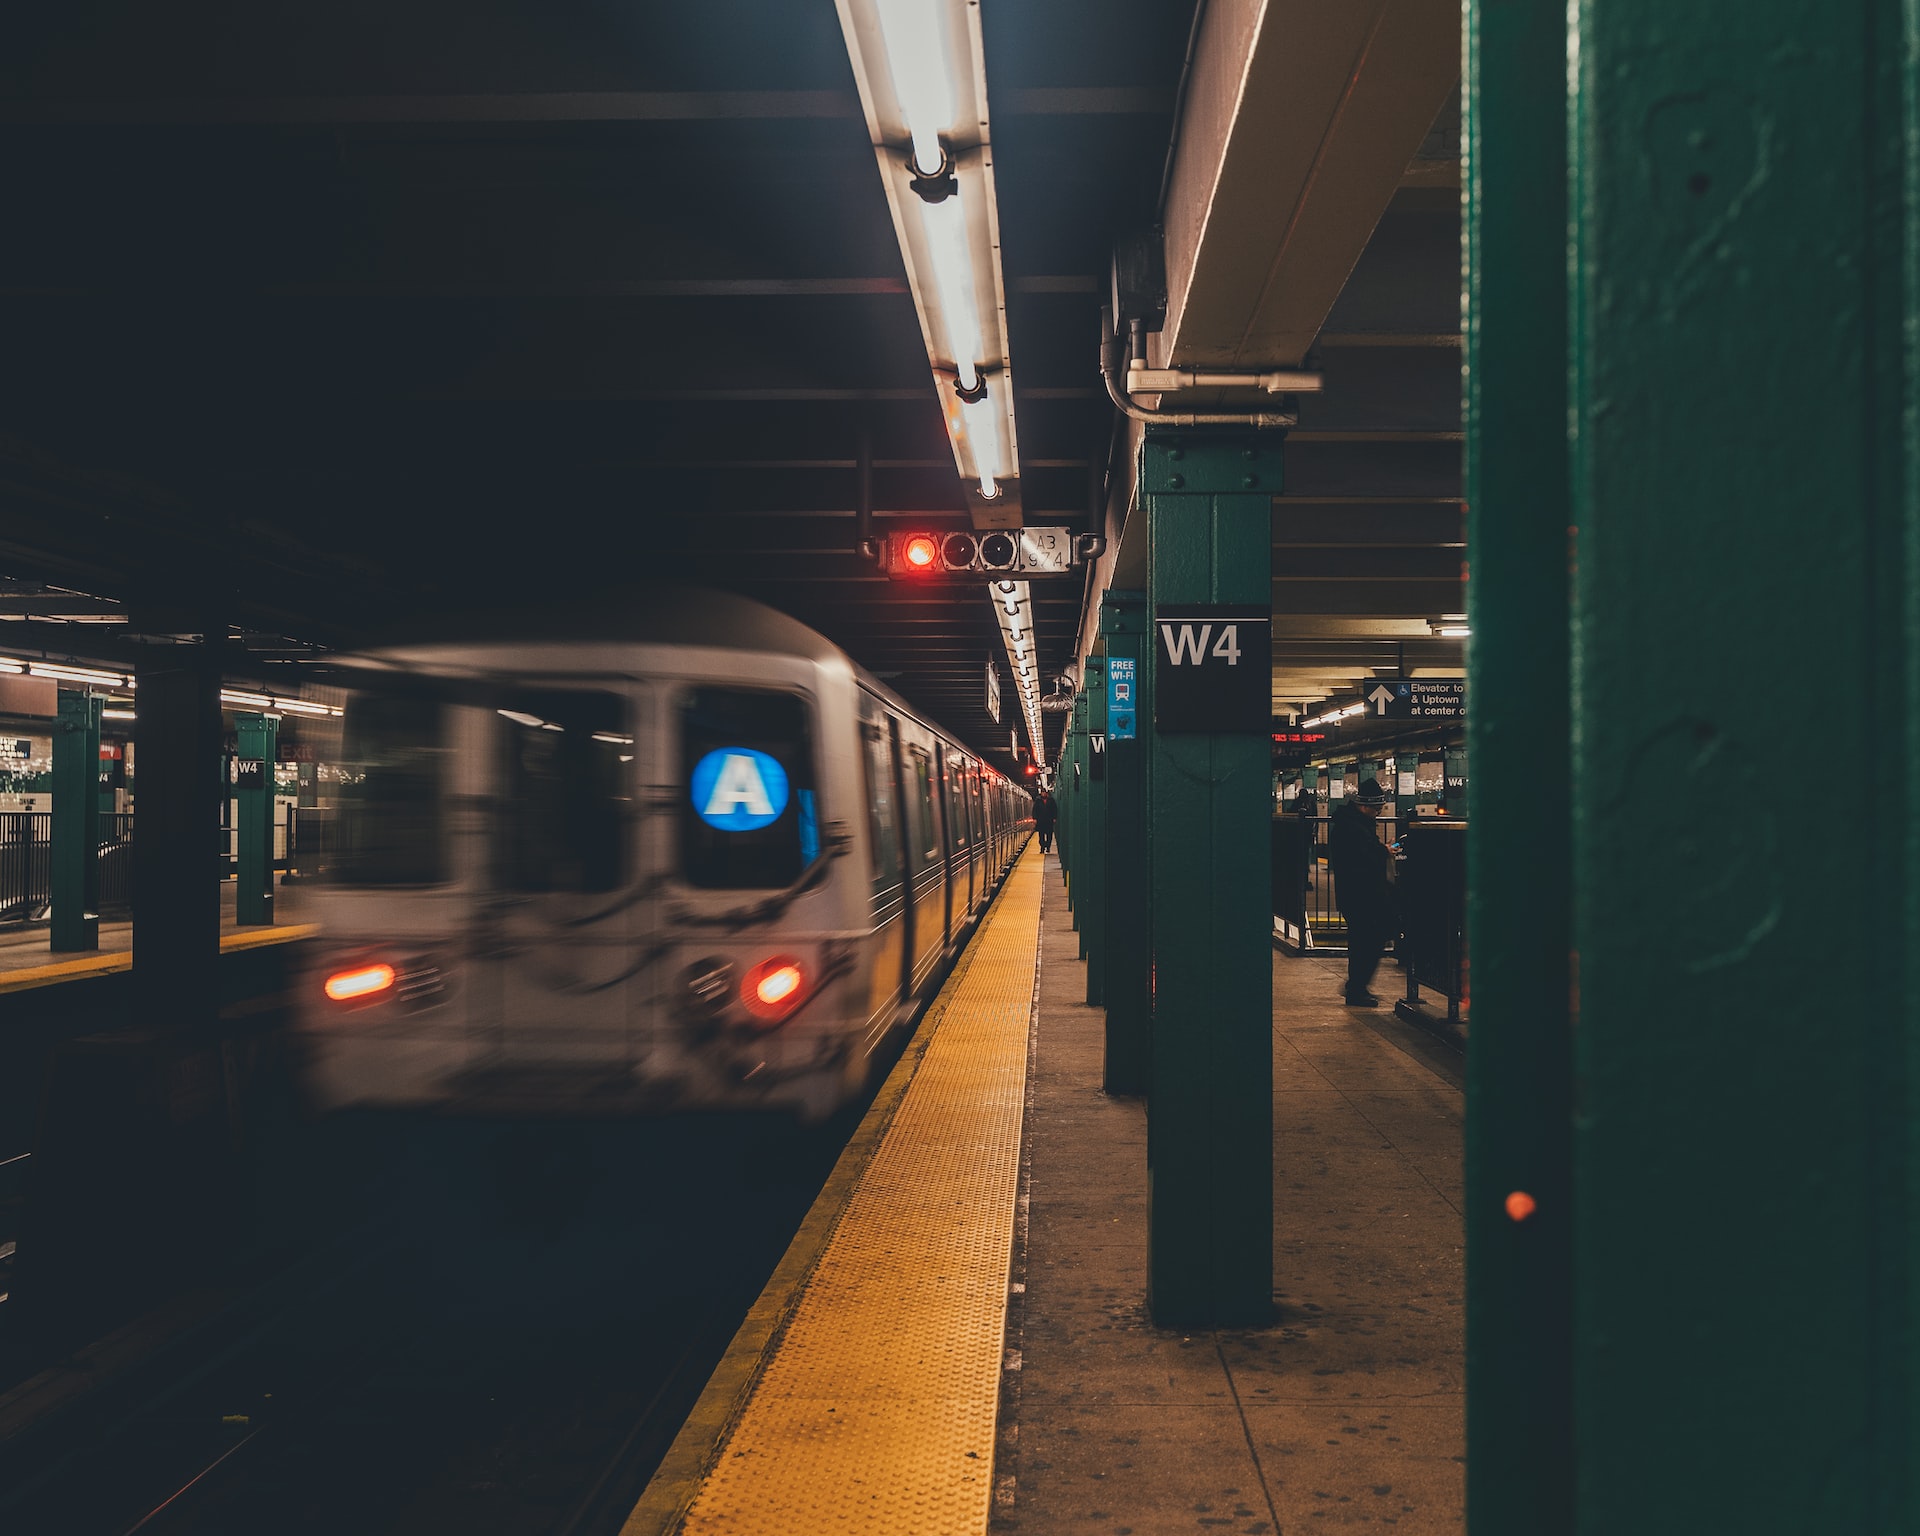
A moving "A" train at the West Fourth Street subway station. (Photo Credit:Nic Y-C on Unsplash )
By Angel Adegbesan
The purpose of this project is to determine how public transit ridership has changed in New York City in a year.
For this project we examined the turnstile and metro card swipes data from the Metropolitan Transit Authority, the state agency that runs the city’s subways and buses. We use both data sets to compare subway ridership in the first four months of 2021 to the first four months of 2022.
Our hypothesis is that the number of users entering a subway station will have increased year over year. We also hypothesize that the number of users swiping a metro card will have decreased, given the widespread availability of OMNY systems that allows users to tap a contactless card to pay the fare. We believe it would have impacted the use of traditional metro cards.
First, we pulled the turnstile data from Jan 01, 2021 to April 30, 2021 as well as from Jan 01, 2022 to April 30, 2022. The data was divided into weekly numbers that contained the date, time, and number of entries and exits for turnstiles at over 400 subway stations. Then, we sorted and analyzed the data to ultimately derive three categories: the station names, dates and the number of entries. We further compressed the weekly dates into months, so we have the total number of turnstile entry at each subway station for the months of January, February, March and April in both 2021 and 2022.
Then, we pulled the metro card data from the MTA that shows the type and number of metro card used at each subway station per week. Again, we pulled data from Jan 01, 2021 to April 30, 2021 as well as from Jan 01, 2022 to April 30, 2022. Similar to the turnstile data, we sorted and analyzed the data to give us three categories: the station names, dates, and total number of metro cards used. Then, we compressed the weekly dates into months, so we have the total number of swipes at each subway station for the months of January, February, March and April in both 2021 and 2022.
After sorting, we were able to derive the kind of Swipe dataset and Turnstile dataset that we liked from each scrape. Then we made simple calculations on the numbers to find out the percent difference from the previous year’s for both datasets.
Ultimately, we found out two things which are the complete opposite of our hypothesis: in most stations, people entering the subway system typically decreased and the number of metrocard swiped into a station typically increased in 2022. Overall, we found that the number of swipes in the first four months of 2022 increased by an average of 47 percent from the same period in 2021. On the other hand, the number of people entering a subway station in the first four months of 2022 only increased by an average of 15 percent from the same period in 2021.
Why? We theorize that the reduced number of people entering the stations could be because of the omicron variant that led many workers to return to remote work.

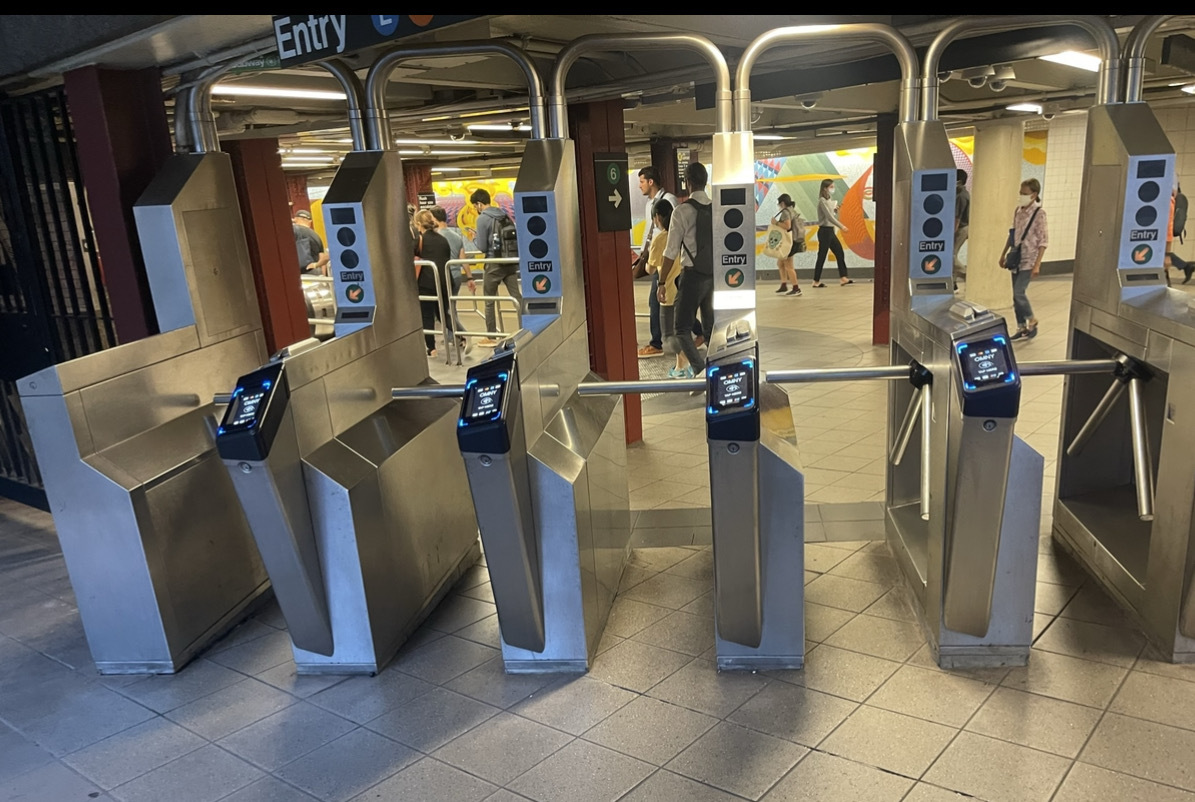
The entrance to the Lexington ave-53rd street subway station. Photo Credit: Angel Adegbesan
We also wanted to see if there were possible outliers that corresponded with our original hypothesis. So we compared the swipe numbers and turnstile entry numbers of each station to see if there were cases where swipe decreased and entry increased.
We encountered a roadblock with this where we found out that the subway stations in the Swipe dataset were named differently from the subway stations in the Turnstile dataset. After filtering and sorting in Excel, we were able to find about 168 out of more than 400 subway stations that were named similarly. We used the VLookup function in Excel to match the turnstile numbers and swipe numbers for these stations.
From there, we discovered about four outliers that corresponded with our initial hypothesis. The main two: Hewes Street-Broadway and the 72nd Street-2nd Avenue stations had an increased number of people entering the station in 2022 compared to the previous year’s, and had a decreased or slightly increased number of people swiping a metro card.
So, overall we found that subway ridership in New York is nowhere on track to reaching pre-pandemic levels. Senior officials have said the MTA may not reach pre-covid levels of ridership until 2035. The agency needs riders to finance its operations and low ridership is causing a drain on funds. Officials are already looking at new sources of funding to supplement the depleting revenue. One proposed plan is to charge a congestion fee for people driving into Manhattan, that will bring about $1 billion in yearly revenue, which can in turn be invested in public transit. Another plan that the agency could adopt would involve raising the fare price, which could have severe backlash.
Use the data table below to find the 168 subway stations as well as the percent changes of swipes and turnstile entry for each station.